














Skip to content
Product
PlatformPricingDimensionsIntegrationsSecurityCompare
Solutions · by use case
Customer, guest and fan experienceProduct feedback and prioritizationRevenue, churn and retentionAgenciesContact center performanceAI agent and chatbot analyticsMulti-location performanceReviews and competitive benchmarking
Solutions · by industry
Hotels and hospitalityRestaurants and food serviceFitness, golf and recreationRetail and e-commerceSports and live entertainmentInsuranceBanking and financial servicesSoftware and SaaSAutomotiveConsumer products and CPGContact centers and BPOsPublic sector and nonprofitReal estateGaming and betting
Learn
Artifacts GalleryCustomer storiesResearchBlogThought leadershipLessons Log in Start now
Dimension Labs

Use case

Multi-location performance

Compare every hotel, store, club or restaurant on the same Dimensions. Find why one location outperforms another, and which fix would move the rating.

Ask Why does one location outperform another?

We work with enterprises such as NBA, Travelers, Mars and Concentrix.

NBATravelersMarsDisneyConcentrixIntuitSeattle MarinersDropboxAmerican Red CrossResideoNetflixThomson ReutersAsicsStakeEasygoFleishmanHillard
[01] The problem

Two locations, same brand, same training. A full star apart.

Location reports rank sites by score. They can't tell you what the better site does differently, because every location's comments are coded differently, or not at all.

Right now
  • 01Sites are ranked by score, never explained
  • 02Every region codes feedback its own way
  • 03Best practices spread by anecdote
  • 04Regional managers can't compare like with like
  • 05The fix that worked in one site never gets tested in another

The difference between your best and worst location is written down, thousands of times.

[02] EnrichOne record, structured

Language in. Structured data out.

Every record is read in full and written back with dozens of typed Dimensions, the same way every run. Here is what that looks like for this use case.

enrichment · one record
Raw text

Waited 25 minutes in the drive-thru and they still forgot the kids' meals. The shift lead at the window was great about it, but this is the third time at this location.

Google review · 2 stars · store joined
Dimensions written to the record
  • Service Speed & Wait25 min · drive-thru
  • Transaction / Visit Typedrive-thru
  • Order & Service Accuracyitems missing
  • Staff Interaction Qualitypositive · named role
  • Service Recoveryattempted
  • First-Time vs. Repeatrepeat · 3rd incident
  • Location Referencedthis store

Each colour links a phrase in the raw text to the Dimensions extracted from it. Hover either side.

[03] The product
3.1 · Read everything

Every record, enriched.

Start with one export of reviews, surveys and tickets from every location, or connect every channel. Every record comes back with typed Dimensions like location referenced, service speed and wait, staff interaction quality, facility and cleanliness and order accuracy, written the same way every run, then joined to location, region, format, staffing and sales data.

  • Read every record, not a sample
  • Join each record to location, region, format, staffing and sales data
  • Add your own Dimensions in plain English
  • Backfill years of history in the same run
dimension labs · blend
3.2 · Prove the cause

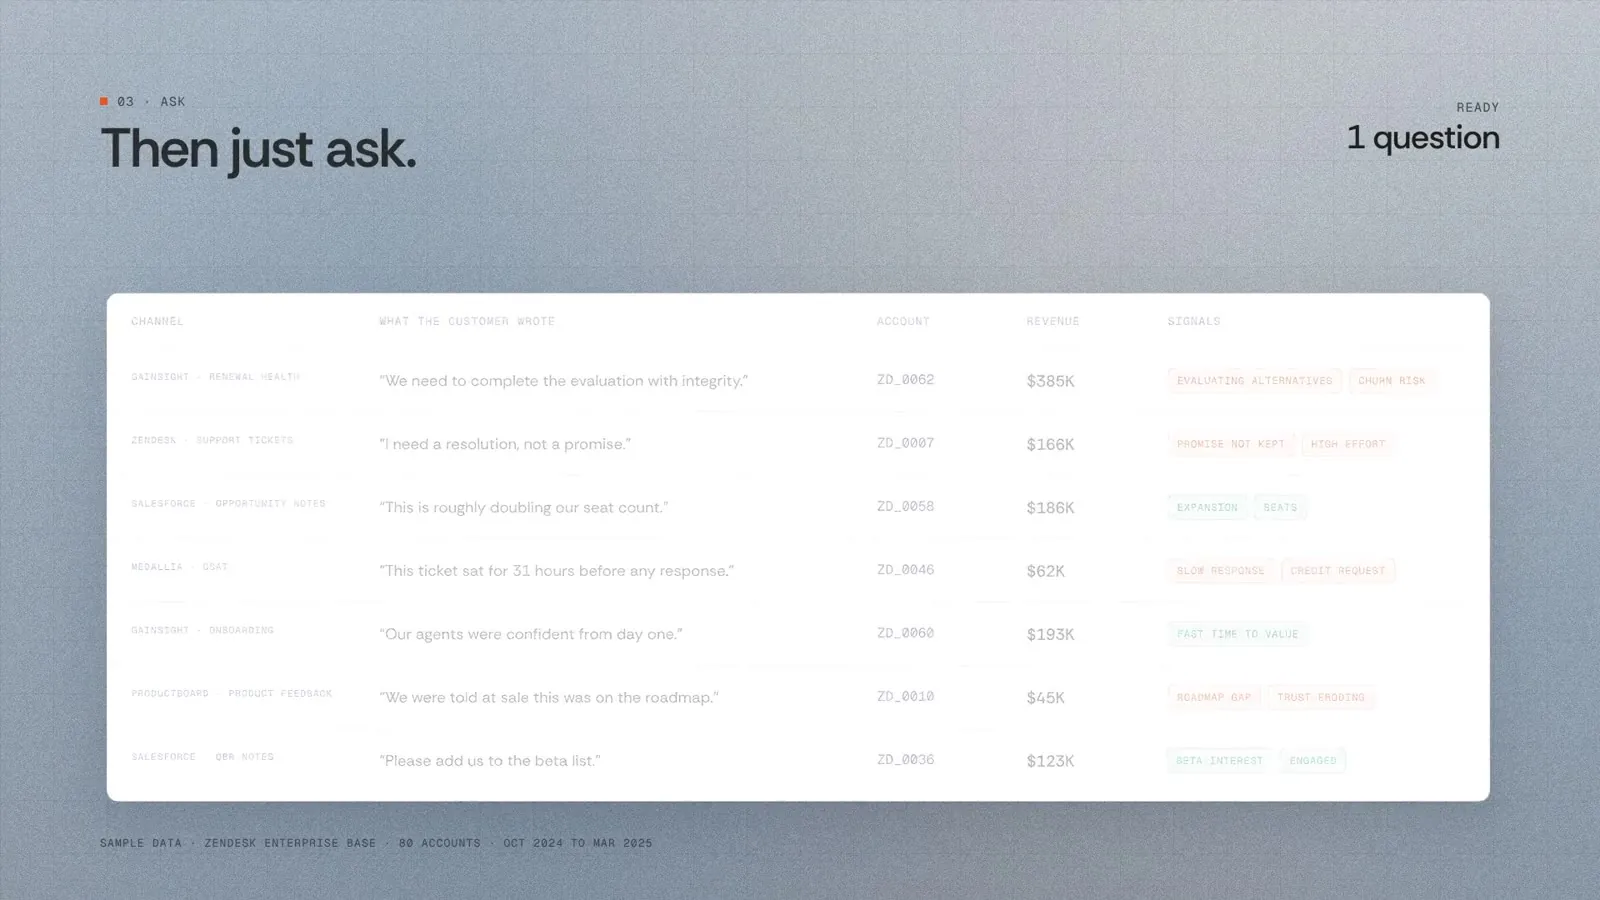
Ask why. Get proof.

Ask in plain English. The agent writes the queries, controls for what would confound the answer, and ranks each issue by its measured effect on rating, revisit and revenue per location, with an effect size and a confidence interval. Findings that fail the robustness checks are never reported as causal.

  • Why does one location outperform another
  • Rank each site's drivers by their effect on rating
  • Find the operators and practices worth copying
  • Track whether a fix moved one site's score
dimension labs · ask
Example finding

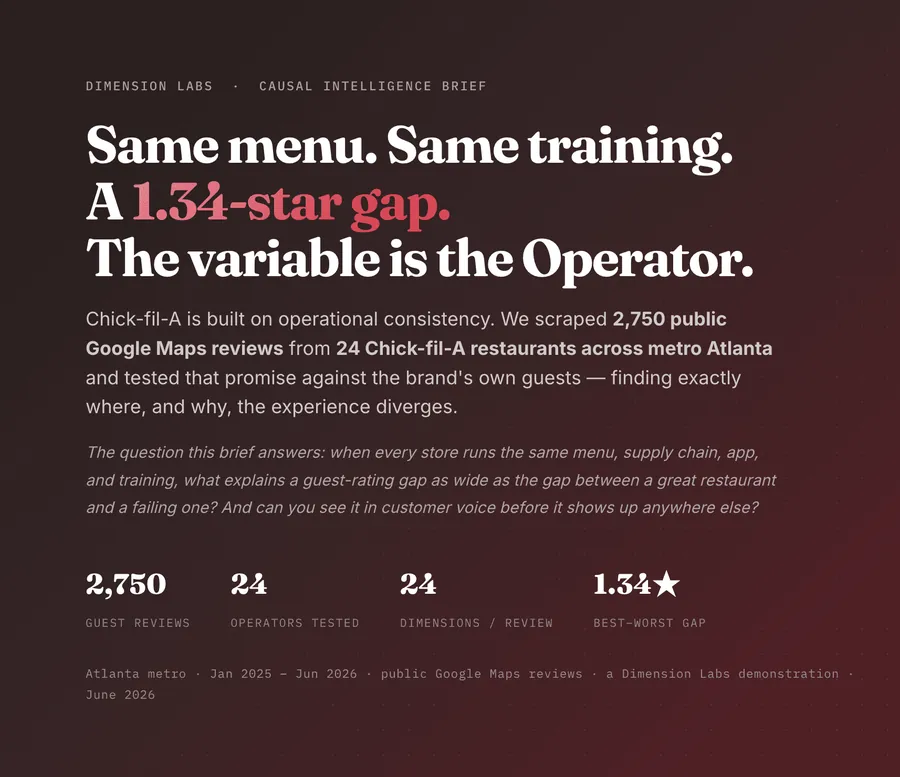
Why does one location outperform another?

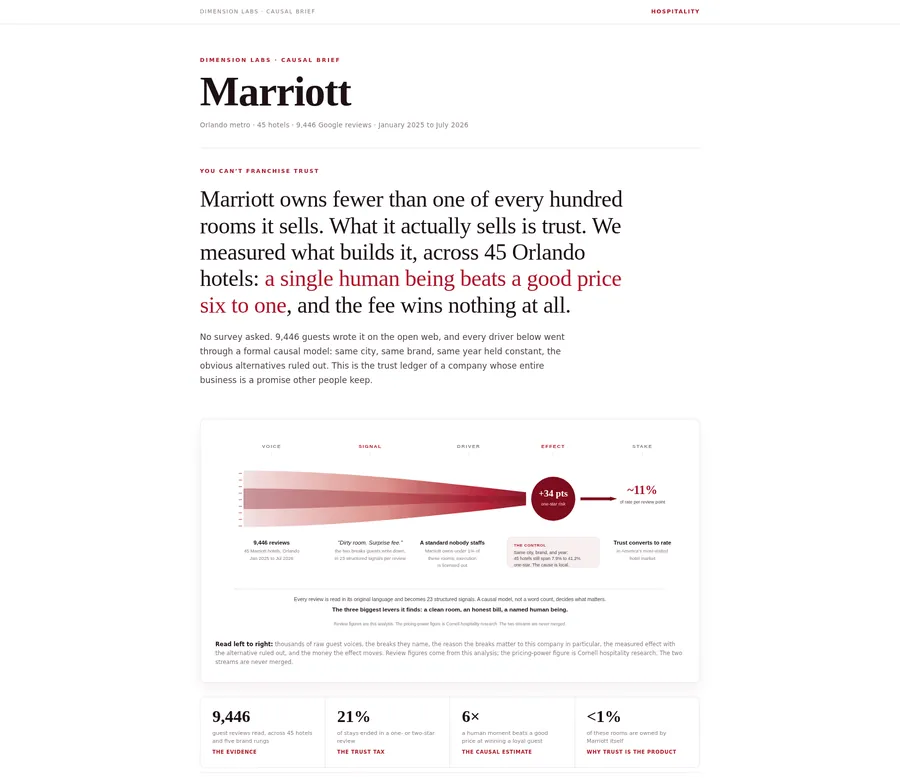
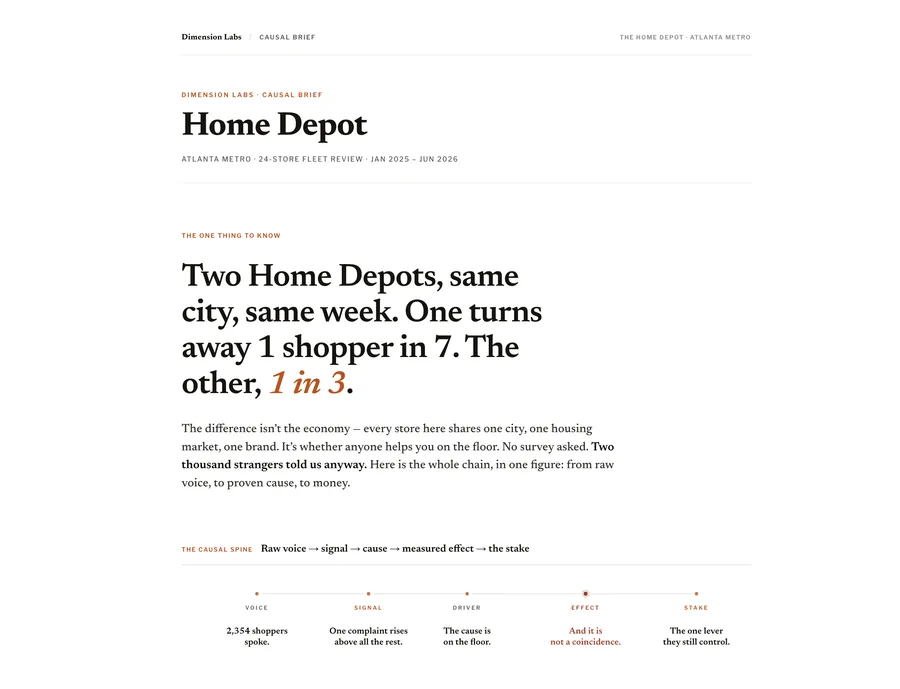
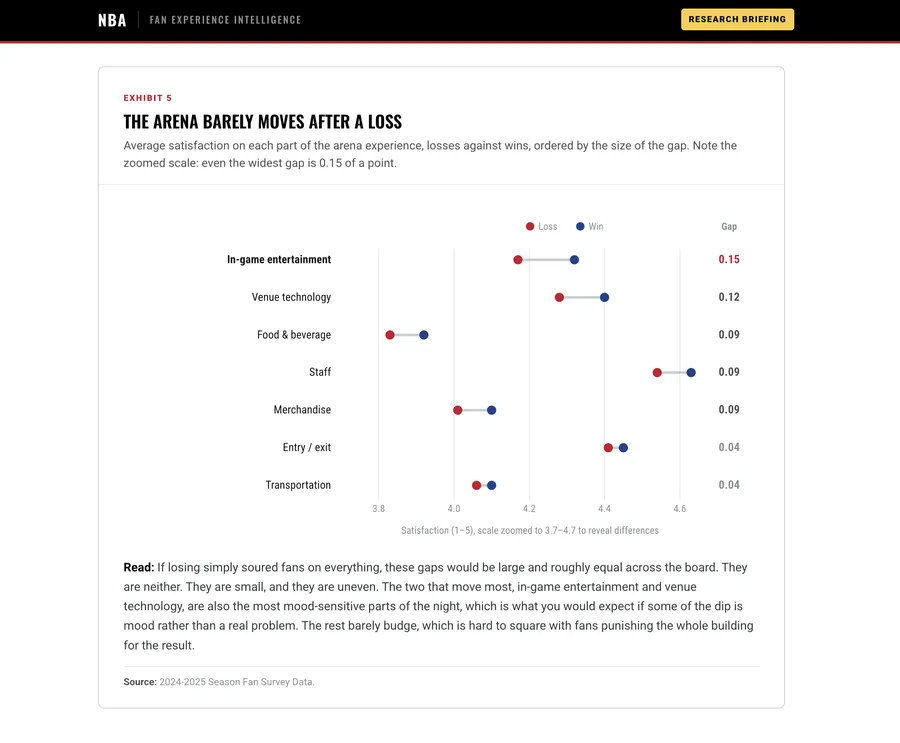
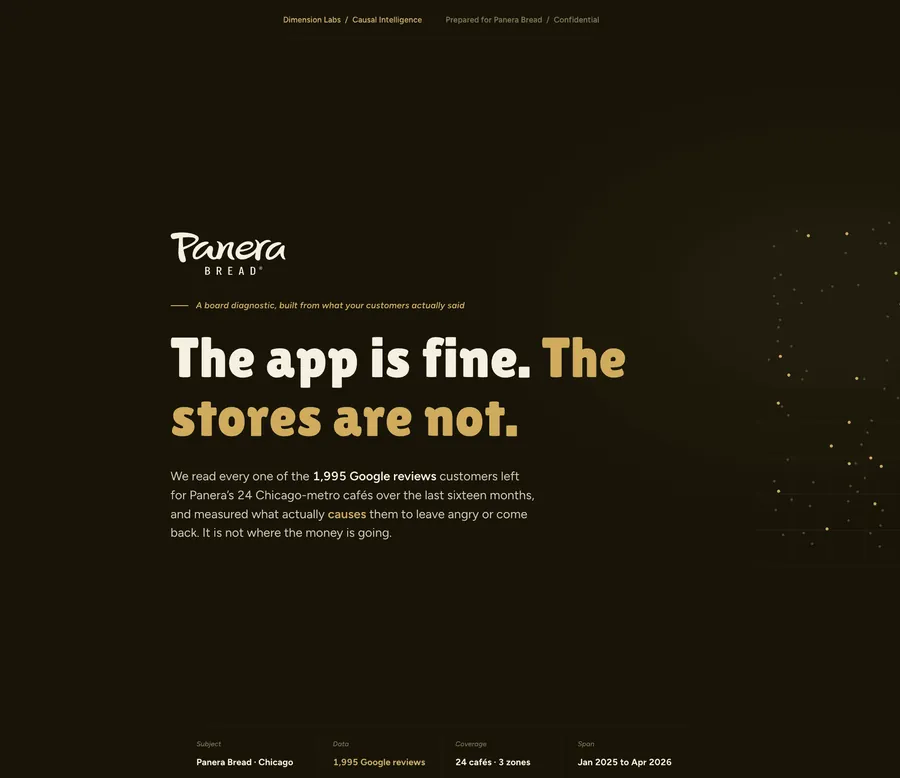
See the Chick-fil-A customer review analysis: 24 Dimensions across public Google Maps reviews, compared location by location.

Published artifact · public reviews
3.3 · Deliver

Ask for the report. Get the report.

Ask for the readout your regional managers needs and the agent builds it: summary, ranked findings, charts and recommendations, each figure checked. Schedule it weekly or monthly on fresh data, or publish it as a live monitor.

  • Produce the monthly readout without building it
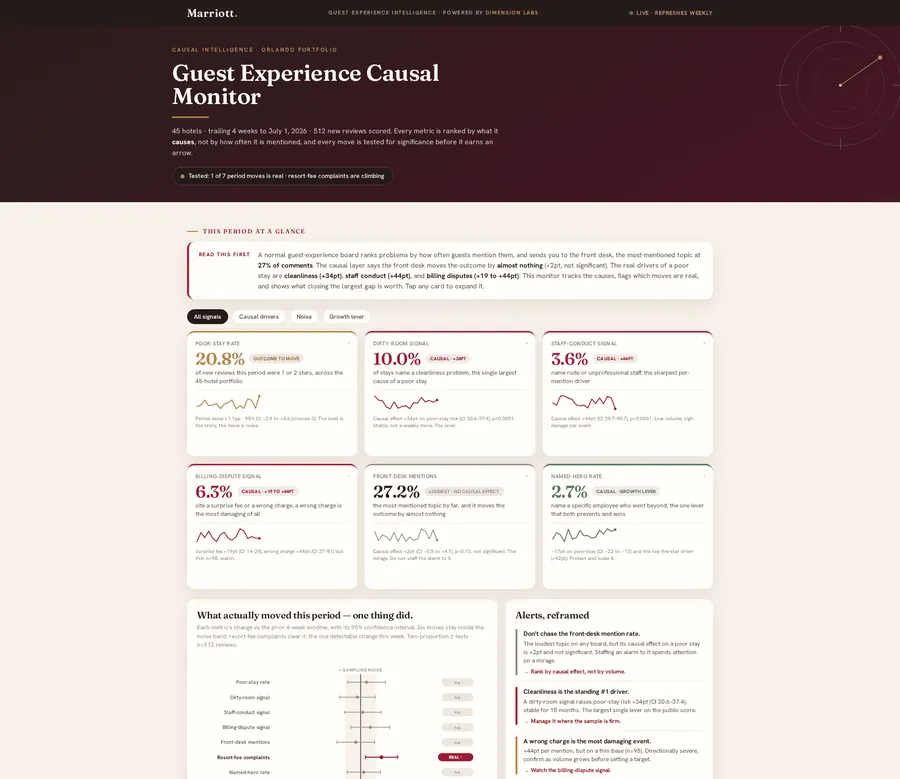
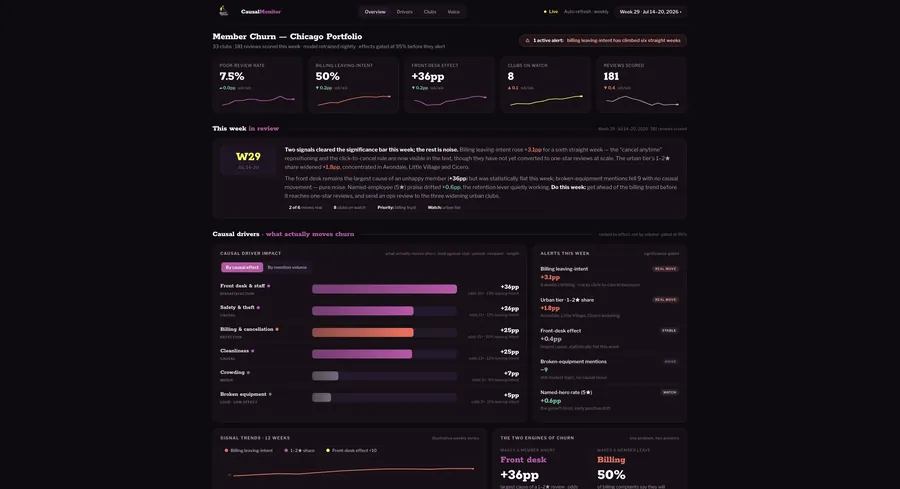
  • Publish a live monitor leadership can open and question
  • Track whether the fix you shipped moved the number
  • Export to PDF, slides or your BI tool
dimension labs · report
[04] How the platform worksRuns daily

From raw conversations to a proven answer.

Language from every channel and your business data flow into one pipeline that enriches, governs and tests every record, then delivers wherever your team works.

Language · 37 sources
ZendeskIntercomSalesforceLiveChatDriftSlackQualtricsMedalliaSurveyMonkeyQuestionProGenesysAmazon ConnectAvaya Cloud8x8TwilioSMSAdaKore.aiYellow.aiCognigyRasaMicrosoft Bot FrameworkAmazon LexAmazon AlexaOracle Digital AssistantBotcopyCapacityFacebook MessengerKikX (Twitter)OpenAIEmailCall recordingsApp store reviewsGoogle reviewsOpen-ended surveysCommunity forums
Business + world data
SnowflakeDatabricksBigQueryAmazon S3Salesforce CRMCSV + ExcelREST APIRevenueOrdersRenewalsUsage eventsLoyaltyStore + location dataWeatherSeasonalityMarket events
Dimension Labs pipeline · Runs daily
01
Ingest + normalizeEvery channel and language into one schema
02
EnrichDozens of Dimensions written onto every record
03
Map + governValidated for drift, versioned, the same fields every run
04
Analyze + proveJoined to outcomes and tested for cause
Where it goes
Dimension Labs agentAsk, report, schedule
Your warehouseSnowflake, Databricks, BigQuery
BI toolsTableau, Power BI, Hex
Claude and ChatGPTvia MCP · coming soon
[05] ArtifactsBuilt by the agent

What you get. Reports, monitors and decks, built by the agent.

Reports · Live monitors · Apps · Decks · Charts See every artifact ›
[06] Proof

See it on real data.

See the artifacts ›
Dimension Labs/Start with one file From $299 a month

Find out what's really moving your number.

Start with one file. Ask why a number moved. Plans from $299 a month, no demo and no contract on monthly plans.